I recently started using the escape analysis report that the go build tool provides. I’m still new to it, but what I get out
of it so far is knowing if a function can be inline, and/or if a parameter/variable escapes the stack and is allocated in the heap.
The short and simplified version of why it is good when your function is inlined is that it saves the overhead of a functionn call by copying the body of the “external” function into the code where you are calling the function from.
What about parameters/variables escaping to the heap? Let’s just say it’s good to avoid them.
Step 0 - Disclamer
Please take the time to measure the performance of your app before you apply performance techniques to your code. You may be surprised to know that the ugly code you ended up writing in the name of better performance and lower memory usage ended up using the same memory as easier to read code.
Or the gain of 0.5 seconds means nothing when the complete process you are running takes 2 hours. But now every developer after you will have to spend a lot of time trying to understand what you were thinking.
Step 1 - Look at your metrics
With that disclamer out of the way, this was my first step, looking at our datadog charts for signs of trouble:
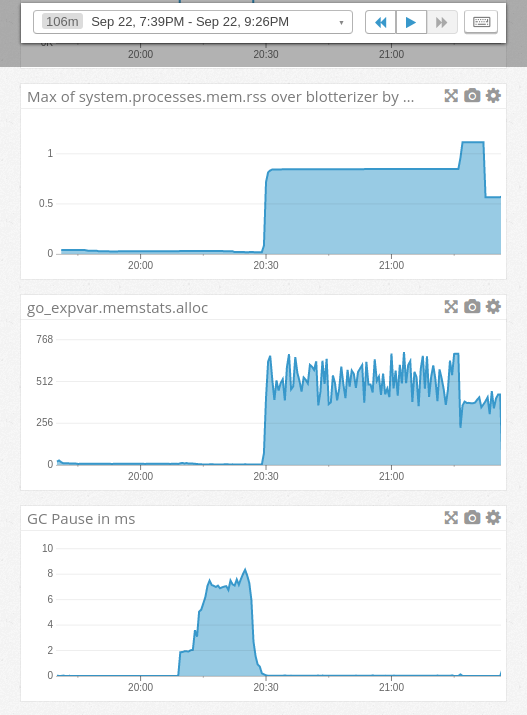
- The first chart shows our go program using around 1GB of ram
- The second chart shows bytes allocated and not yet freed, between 400 and almost 700MB
- The 3rd chart shows the first half of this process causes garbage collections pauses of the tool, max at around 8 ms
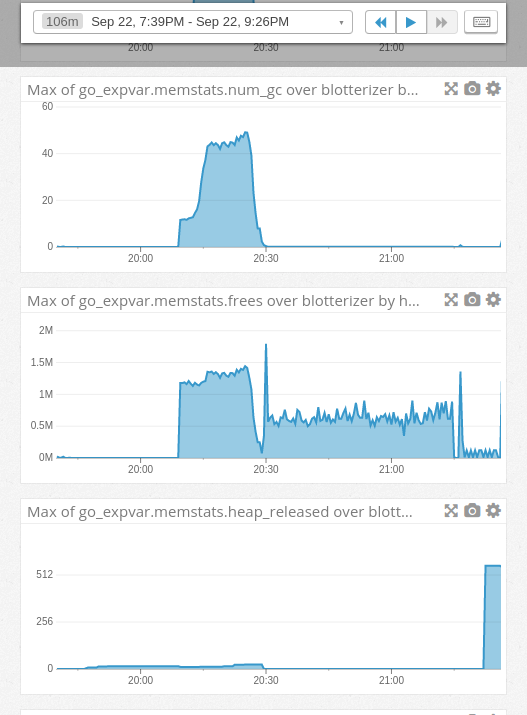
- Number of completed garbage collections
memstats.freesis the count of frees operations (you can think of it as the opposite of mallocs)- Finally, the bytes released to the OS. The scale here is in MB.
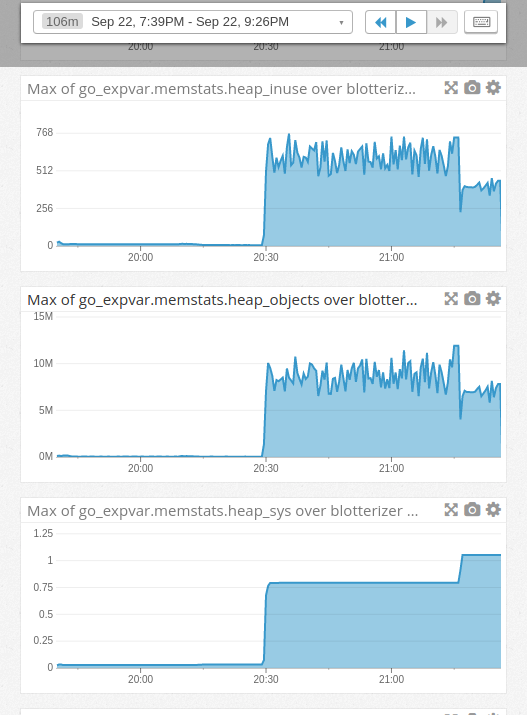
heap_inuseis bytes in in-use spans. Here we see them in MB. A longer description can be seen on the docsheap_objectsis the total number of allocated objects. We have a max of about 12 million objects.head_sysare bytes of heap memory obtained from the OS. Max of 1GB in our case.
- Here we have the count of heap objects allocated.
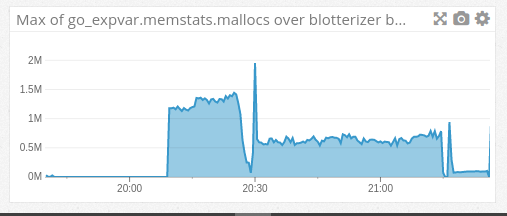
I knew that the initial part of the process, which was loading data from csv files and doing clean up, was an area that could use some love, and the charts agreed. This is the portion of the process where we use the most memory and make the most allocations.
Step 2 - Identify bottleneck
Let’s try my new toy, the escape analysis.
go build -gcflags "-m -m" 2> escape.txt
313KB of text telling all kinds of things about our little app.
These were the first two lines that apply to loading data:
loader/loader.go:50:6: can inline adjustCommission as: func(float64, float64, float64)
float64 { if c < 0.1 { return i * c * q }; return i * c }
loader/loader.go:57:6: cannot inline gimmeTransactionType: unhandled op range
Let’s take a look at gimmeTransactionType:
func gimmeTransactionType(rawTransactionType string) string {
	for _, val := range CodesBuy {
		if strings.ToLower(rawTransactionType) == val {
			return constants.Buy
		}
	}

	for _, val := range CodesSell {
		if strings.ToLower(rawTransactionType) == val {
			return constants.Sell
		}
	}

	for _, val := range CodesShort {
		if strings.ToLower(rawTransactionType) == val {
			return constants.Short
		}
	}

	for _, val := range CodesCover {
		if strings.ToLower(rawTransactionType) == val {
			return constants.Cover
		}
	}

	if rawTransactionType == "" {
		return ""
	}

	return rawTransactionType + "-ERROR"
}
CodesBuy, CodesSell, CodesShort, CodesCover are all []string. The longest is just 15 elements, so they are not huge lists we are walking here. But
we do call this function once 4 times for each row in our files, and we sometimes have about 3 million rows of data to process for a single client.
Looks like we should try to optimize it.
Step 3 - Benchmark
This is an important step, because if we don’t have a benchmark, it becomes a lot harder to measure if your changes are making things better, if your code doesn’t allow you to write a benchmark, please stop now and refactor your code, Go makes writing benchmarks really easy, enjoy it.
In my case, the benchmark code ended up being:
func BenchmarkGimmeTransactionType(t *testing.B) {
	var ret string
	for x := 0; x < t.N; x++ {
		ret = gimmeTransactionType("BUY TO COVER")
	}
	if ret != "Cover" {
		t.Error("failed benchmark for gimmeTransactionType: ", ret)
	}
}
Note how I assign ret from inside the for loop to a variable outside the loop, this is done to make sure the compiler won’t optimize my loop away, making the benchmark useless.
Now that we have the benchmark, let’s use it:
$ go test \
--bench=BenchmarkGimmeTransactionType \
--run="none" \
--mongourl=192.168.1.11:2700/acm-web \
-benchmem \
-memprofile=mem0.out

goos: linux
goarch: amd64
pkg: github.com/ascendantcompliance/acm-go/blotterizer/loader
BenchmarkGimmeTransactionType-8   300000    4173 ns/op    1440 B/op   90 allocs/op
PASS
ok  	github.com/ascendantcompliance/acm-go/blotterizer/loader	2.246s
from the command I run, --run="none" tells the go test tool not to run any of the tests, and --mongourl=mongo-ip:2700/db can be ignored
unless you are one of my coworkers :)
So here we see that we allocate 1440 bytes per operation, make 90 allocations and each op takes about 4173ns on average.
Here you may think, aha, I know what to do, I’ll start changing code around! but wait, there are more tools to explore.
Step 4 - memory profiler
Did you notice the -memprofile=mem0.out parameter to go test? that created a file for us to use like this:
go tool pprof --alloc_space mem0.out
You are now inside the pprof go tool:
$ go tool pprof --alloc_space mem0.out
File: loader.test
Type: alloc_space
Time: Sep 24, 2017 at 10:57pm (EDT)
Entering interactive mode (type "help" for commands, "o" for options)
(pprof)
We are going to see the top memory offenders:
 top
Showing nodes accounting for 703.01MB, 100% of 703.01MB total
      flat  flat%   sum%        cum   cum%
  703.01MB   100%   100%   703.01MB   100%  strings.Map /usr/local/go/src/strings/strings.go
         0     0%   100%   703.01MB   100%  github.com/ascendantcompliance/acm-go/blotterizer/loader.BenchmarkGimmeTransactionType /home/diego/work/golang/src/github.com/ascendantcompliance/acm-go/blotterizer/loader/loader_test.go
         0     0%   100%   703.01MB   100%  github.com/ascendantcompliance/acm-go/blotterizer/loader.gimmeTransactionType /home/diego/work/golang/src/github.com/ascendantcompliance/acm-go/blotterizer/loader/loader.go
         0     0%   100%   703.01MB   100%  strings.ToLower /usr/local/go/src/strings/strings.go
         0     0%   100%   703.01MB   100%  testing.(*B).launch /usr/local/go/src/testing/benchmark.go
         0     0%   100%   703.01MB   100%  testing.(*B).runN /usr/local/go/src/testing/benchmark.go
(pprof)
We see our function is in there, let’s get more details:
(pprof) list gimmeTransactionType
Total: 703.01MB
ROUTINE ======================== github.com/ascendantcompliance/acm-go/blotterizer/loader.gimmeTransactionType in /home/diego/work/golang/src/github.com/ascendantcompliance/acm-go/blotterizer/loader/loader.go
         0   703.01MB (flat, cum)   100% of Total
         .          .     54:	return i * c
         .          .     55:}
         .          .     56:
         .          .     57:func gimmeTransactionType(rawTransactionType string) string {
         .          .     58:	for _, val := range CodesBuy {
         .      173MB     59:		if strings.ToLower(rawTransactionType) == val {
         .          .     60:			return constants.Buy
         .          .     61:		}
         .          .     62:	}
         .          .     63:
         .          .     64:	for _, val := range CodesSell {
         .   257.50MB     65:		if strings.ToLower(rawTransactionType) == val {
         .          .     66:			return constants.Sell
         .          .     67:		}
         .          .     68:	}
         .          .     69:
         .          .     70:	for _, val := range CodesShort {
         .      125MB     71:		if strings.ToLower(rawTransactionType) == val {
         .          .     72:			return constants.Short
         .          .     73:		}
         .          .     74:	}
         .          .     75:
         .          .     76:	for _, val := range CodesCover {
         .   147.50MB     77:		if strings.ToLower(rawTransactionType) == val {
         .          .     78:			return constants.Cover
         .          .     79:		}
         .          .     80:	}
         .          .     81:
         .          .     82:	if rawTransactionType == "" {
(pprof)
Look at that!, we get line by line information. We see that calling strings.ToLower is using a lot of memory, and if that wasn’t
bad enough, we allocate memory on each of the for loops. This is because I picked a string value that is on the last slice (CodesCover)
Step 5 - Refactor!
Now you get to change code, even if you knew what code change should be done after step 2, it is important to confirm it, and by taking the extra time to write a benchmark, we are helping future developers who join our team, we are setting a good path for our app.
There are a number of things I want to change here:
- Instead of having 4 slices, let’s have one map[string]string
- People out there say, don’t work with strings, work with []byte, maybe we can try that
- Don’t call
ToLowerover and over, save it once!
Let’s try number 3, as it is the easiet.
Code now is:
func gimmeTransactionType(rawTransactionType string) string {
	s := strings.ToLower(rawTransactionType)
	for _, val := range CodesBuy {
		if s == val {
			return constants.Buy
		}
	}

	for _, val := range CodesSell {
		if s == val {
			return constants.Sell
		}
	}

	for _, val := range CodesShort {
		if s == val {
			return constants.Short
		}
	}

	for _, val := range CodesCover {
		if s == val {
			return constants.Cover
		}
	}

	if rawTransactionType == "" {
		return ""
	}

	return rawTransactionType + "-ERROR"
}
Let’s rerun our benchmark:
$ go test \
--bench=BenchmarkGimmeTransactionType \
--run="none" \
--mongourl=192.168.1.11:2700/acm-web \
-benchmem \
-memprofile=mem0.out

goos: linux
goarch: amd64
pkg: github.com/ascendantcompliance/acm-go/blotterizer/loader
BenchmarkGimmeTransactionType-8   10000000   119 ns/op   32 B/op  2 allocs/op
PASS
ok  	github.com/ascendantcompliance/acm-go/blotterizer/loader	1.508s
This is a lot better!
Running pprof, we see a confirmation that moving the call ToLower() made a difference:
(pprof) list gimmeTransactionType
Total: 325MB
ROUTINE ======================== github.com/ascendantcompliance/acm-go/blotterizer/loader.gimmeTransactionType in /home/diego/work/golang/src/github.com/ascendantcompliance/acm-go/blotterizer/loader/loader.go
         0      325MB (flat, cum)   100% of Total
         .          .     53:	}
         .          .     54:	return i * c
         .          .     55:}
         .          .     56:
         .          .     57:func gimmeTransactionType(rawTransactionType string) string {
         .      325MB     58:	s := strings.ToLower(rawTransactionType)
         .          .     59:	for _, val := range CodesBuy {
         .          .     60:		if s == val {
         .          .     61:			return constants.Buy
         .          .     62:		}
         .          .     63:	}
(pprof)
Can we do better? Let’s try the []byte idea
…
While looking for the []byte idea, I found strings.EqualFold, which does a case insensitive comparison, which is just what I need.
$ go test \
--bench=BenchmarkGimmeTransactionType \
--run="none" \
--mongourl=192.168.1.11:2700/acm-web \
-benchmem \
-memprofile=mem0.out

goos: linux
goarch: amd64
pkg: github.com/ascendantcompliance/acm-go/blotterizer/loader
BenchmarkGimmeTransactionType-8   5000000   370 ns/op   0 B/op   0 allocs/op
PASS
ok  	github.com/ascendantcompliance/acm-go/blotterizer/loader	2.300s
We got 0 allocations but time went from 119 ns to 370 ns. And here is where I spent about 20 minutes trying to reduce the
time but keep the 0 allocation and eventually I realized that 370ns - 119 ns is 251 ns and that multiplied by the 3 million
records I run through means I’m adding about 0.7 seconds to a process that today takes about 2 hours.
This is another important lesson, don’t get too crazy optimizing your code, sometimes it is not worth it.
Now I’ll send a pull request to our repository and once this is deployed, I’ll try to post a follow up blog with new metrics.
Thank you for reading and don’t hesitate to leave a comment/question.
Diego